
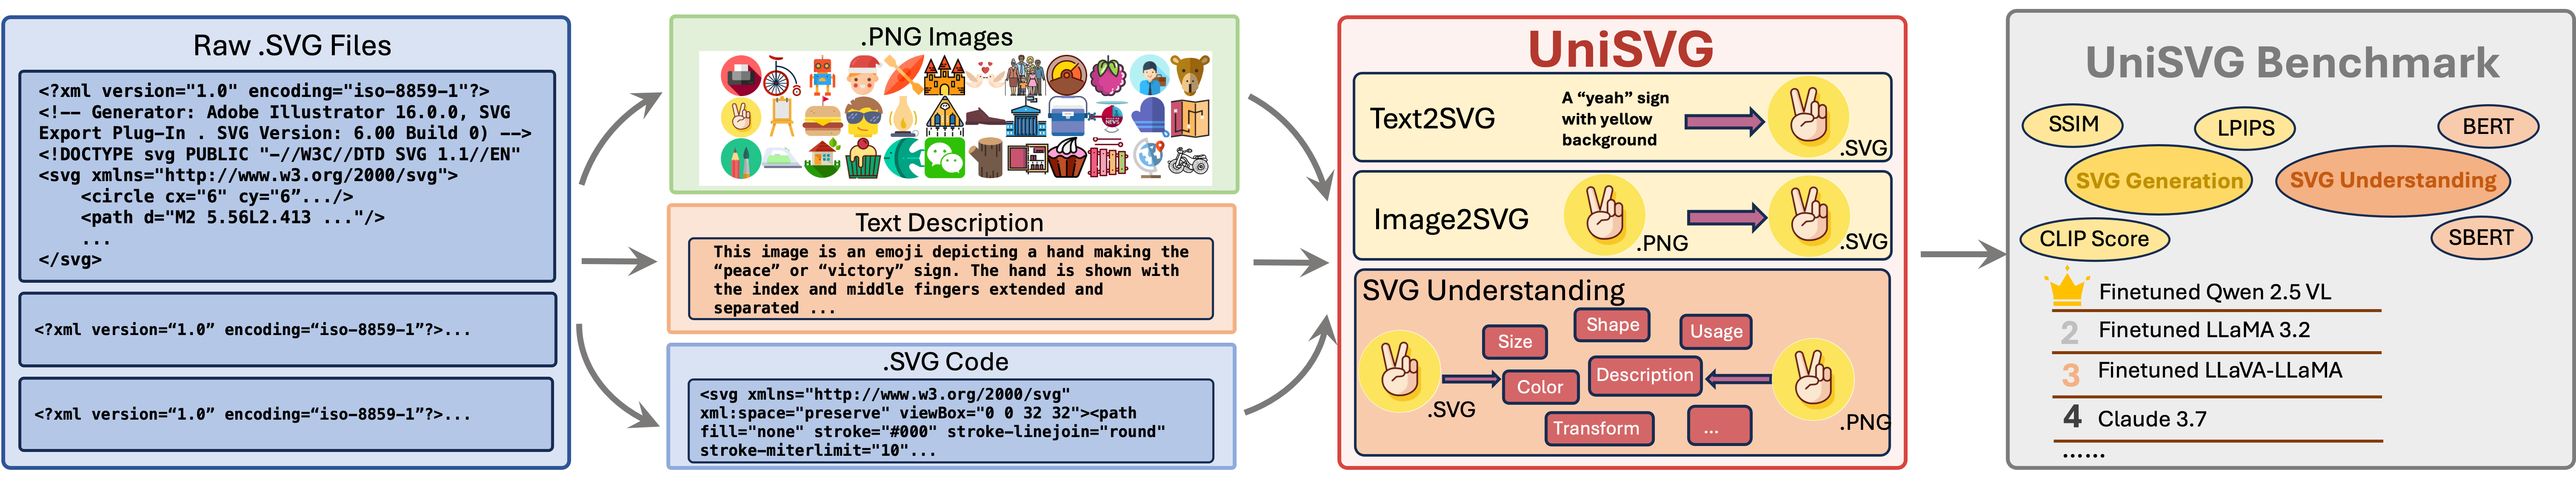
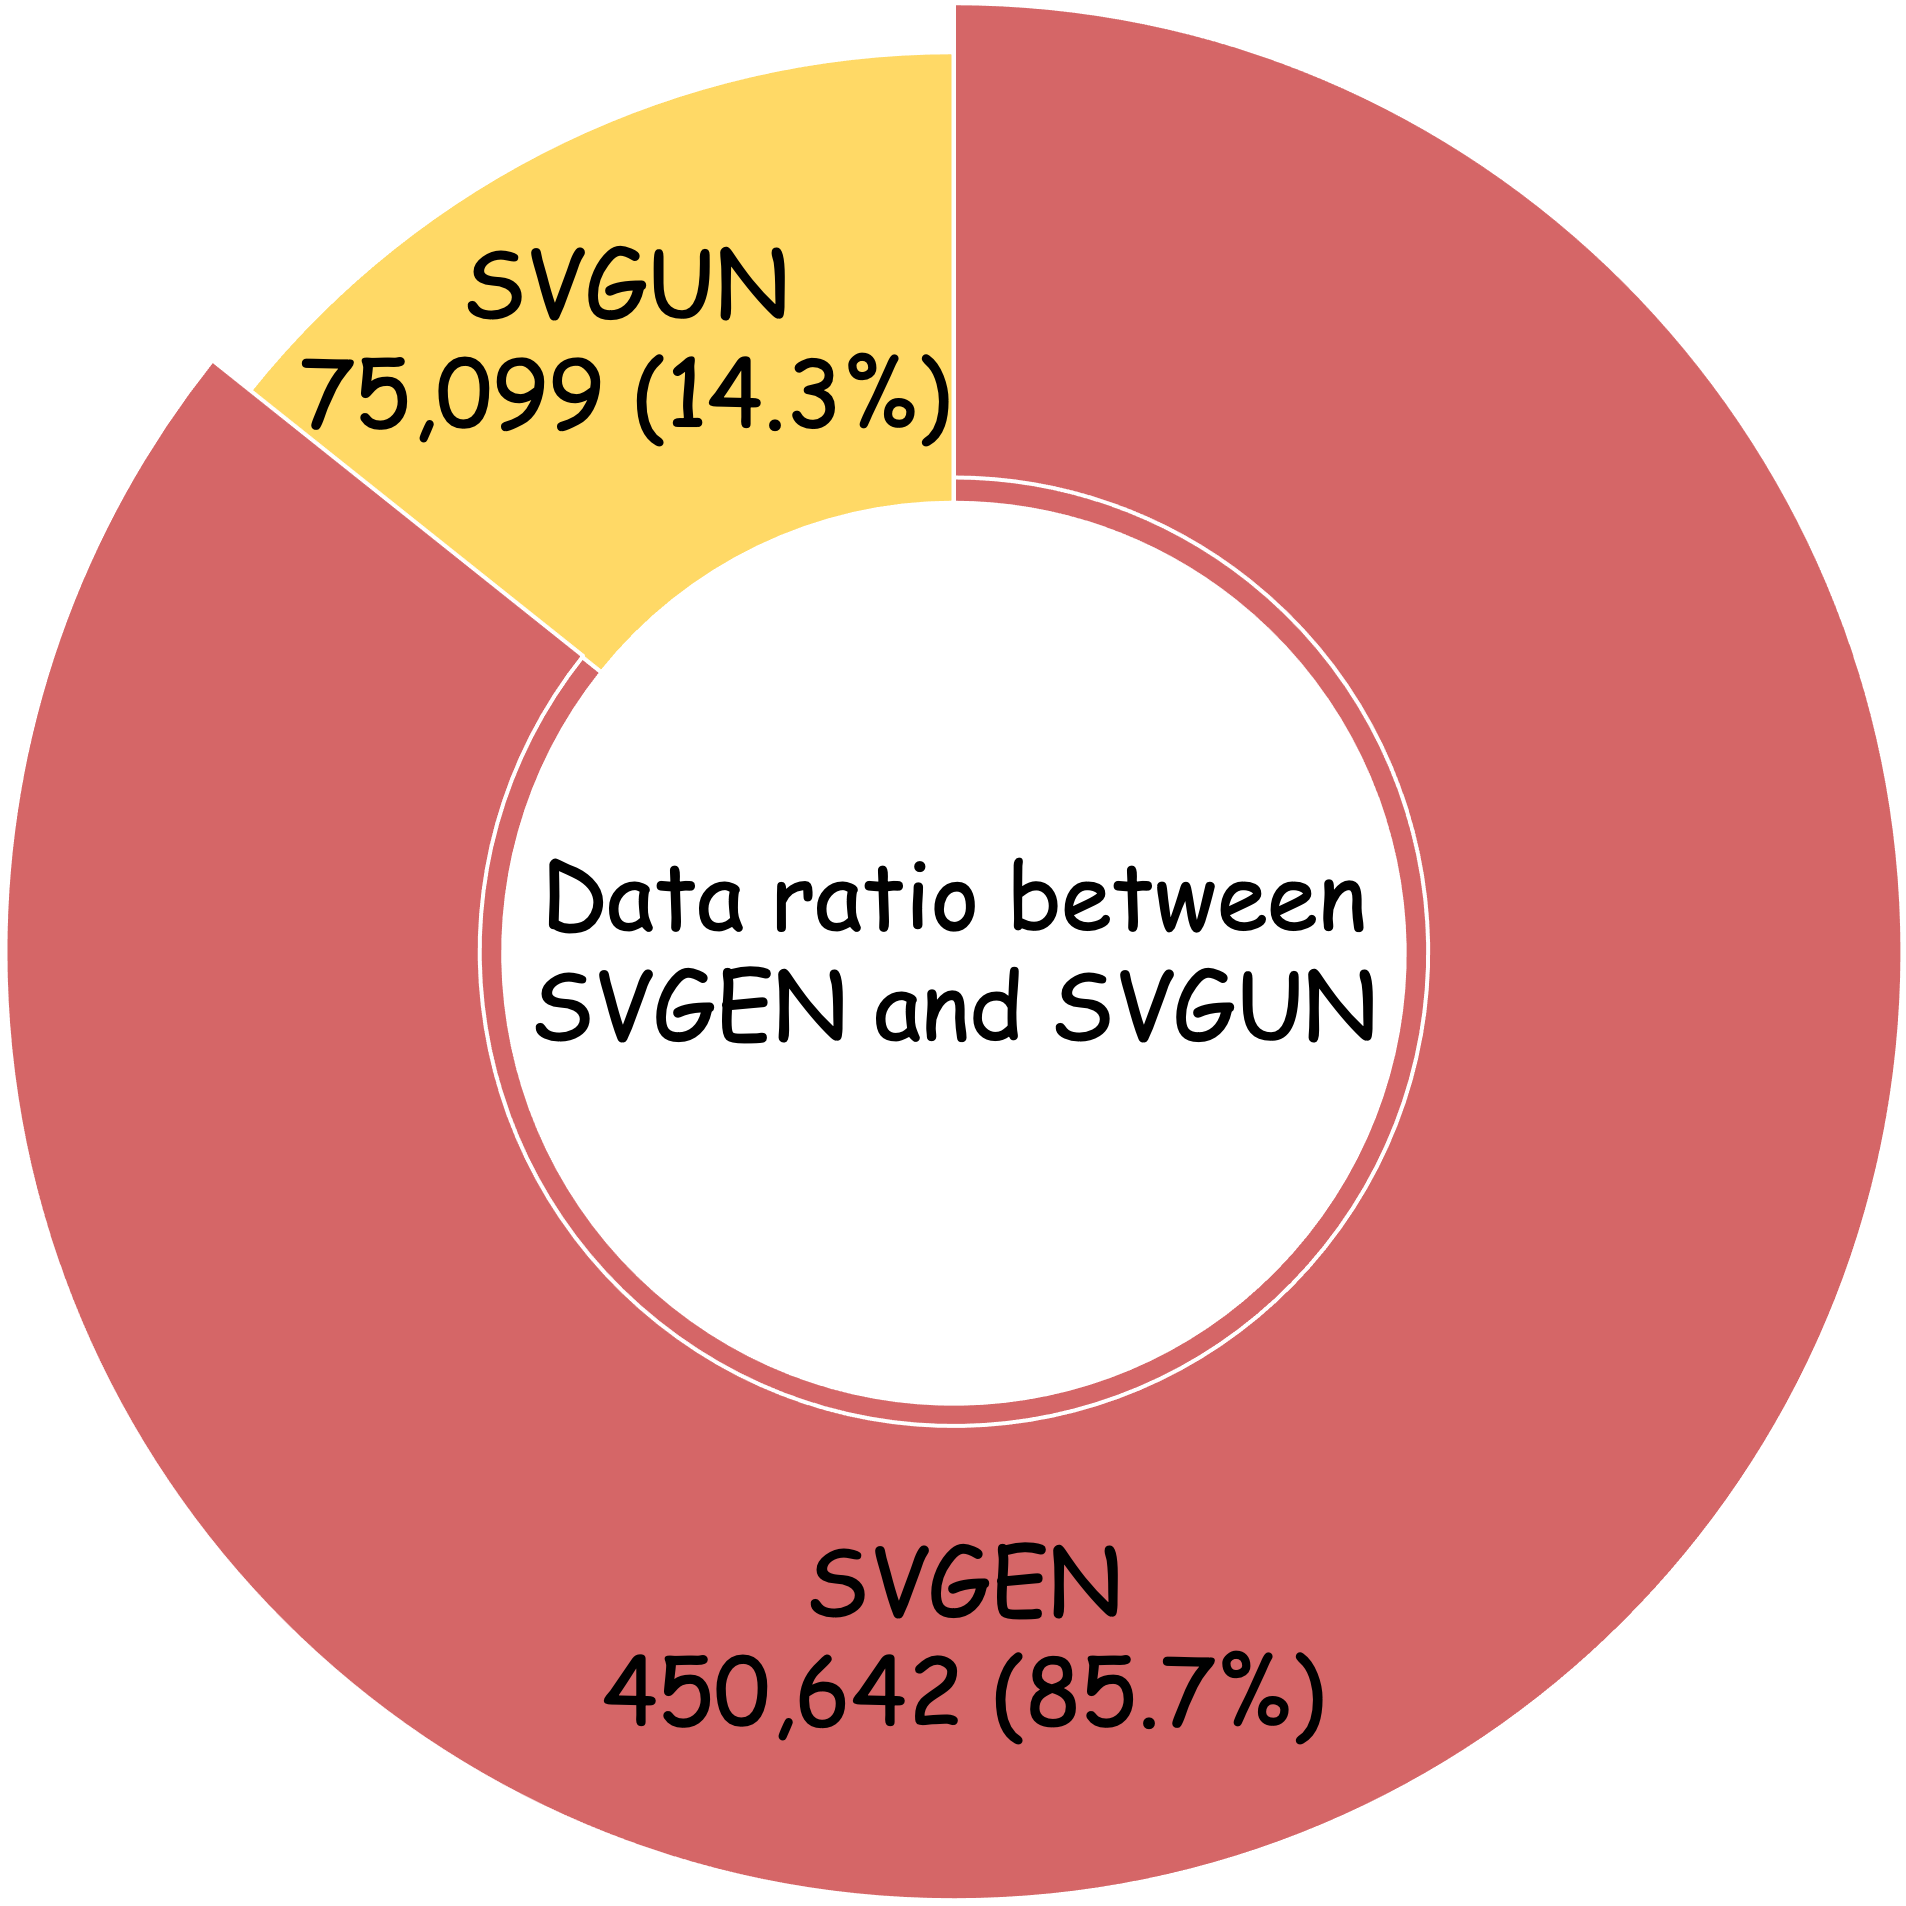
Unlike bitmap images, scalable vector graphics (SVG) maintain quality when scaled, frequently employed in computer vision and artistic design in the representation of SVG code. In this era of proliferating AI-powered systems, enabling AI to understand and generate SVG has become increasingly urgent. However, AI-driven SVG understanding and generation (U&G) remain significant challenges. SVG code, equivalent to a set of curves and lines controlled by floating-point parameters, demands high precision in SVG U&G. Besides, SVG generation operates under diverse conditional constraints, including textual prompts and visual references, which requires powerful multi-modal processing for condition-to-SVG transformation. Recently, the rapid growth of Multi-modal Large Language Models (MLLMs) have demonstrated capabilities to process multi-modal inputs and generate complex vector controlling parameters, suggesting the potential to address SVG U&G tasks within a unified model. To unlock MLLM's capabilities in the SVG area, we propose an SVG-centric dataset called UniSVG, comprising 525k data items, tailored for MLLM training and evaluation. To our best knowledge, it is the first comprehensive dataset designed for unified SVG generation (from textual prompts and images) and SVG understanding (color, category, usage, etc.).
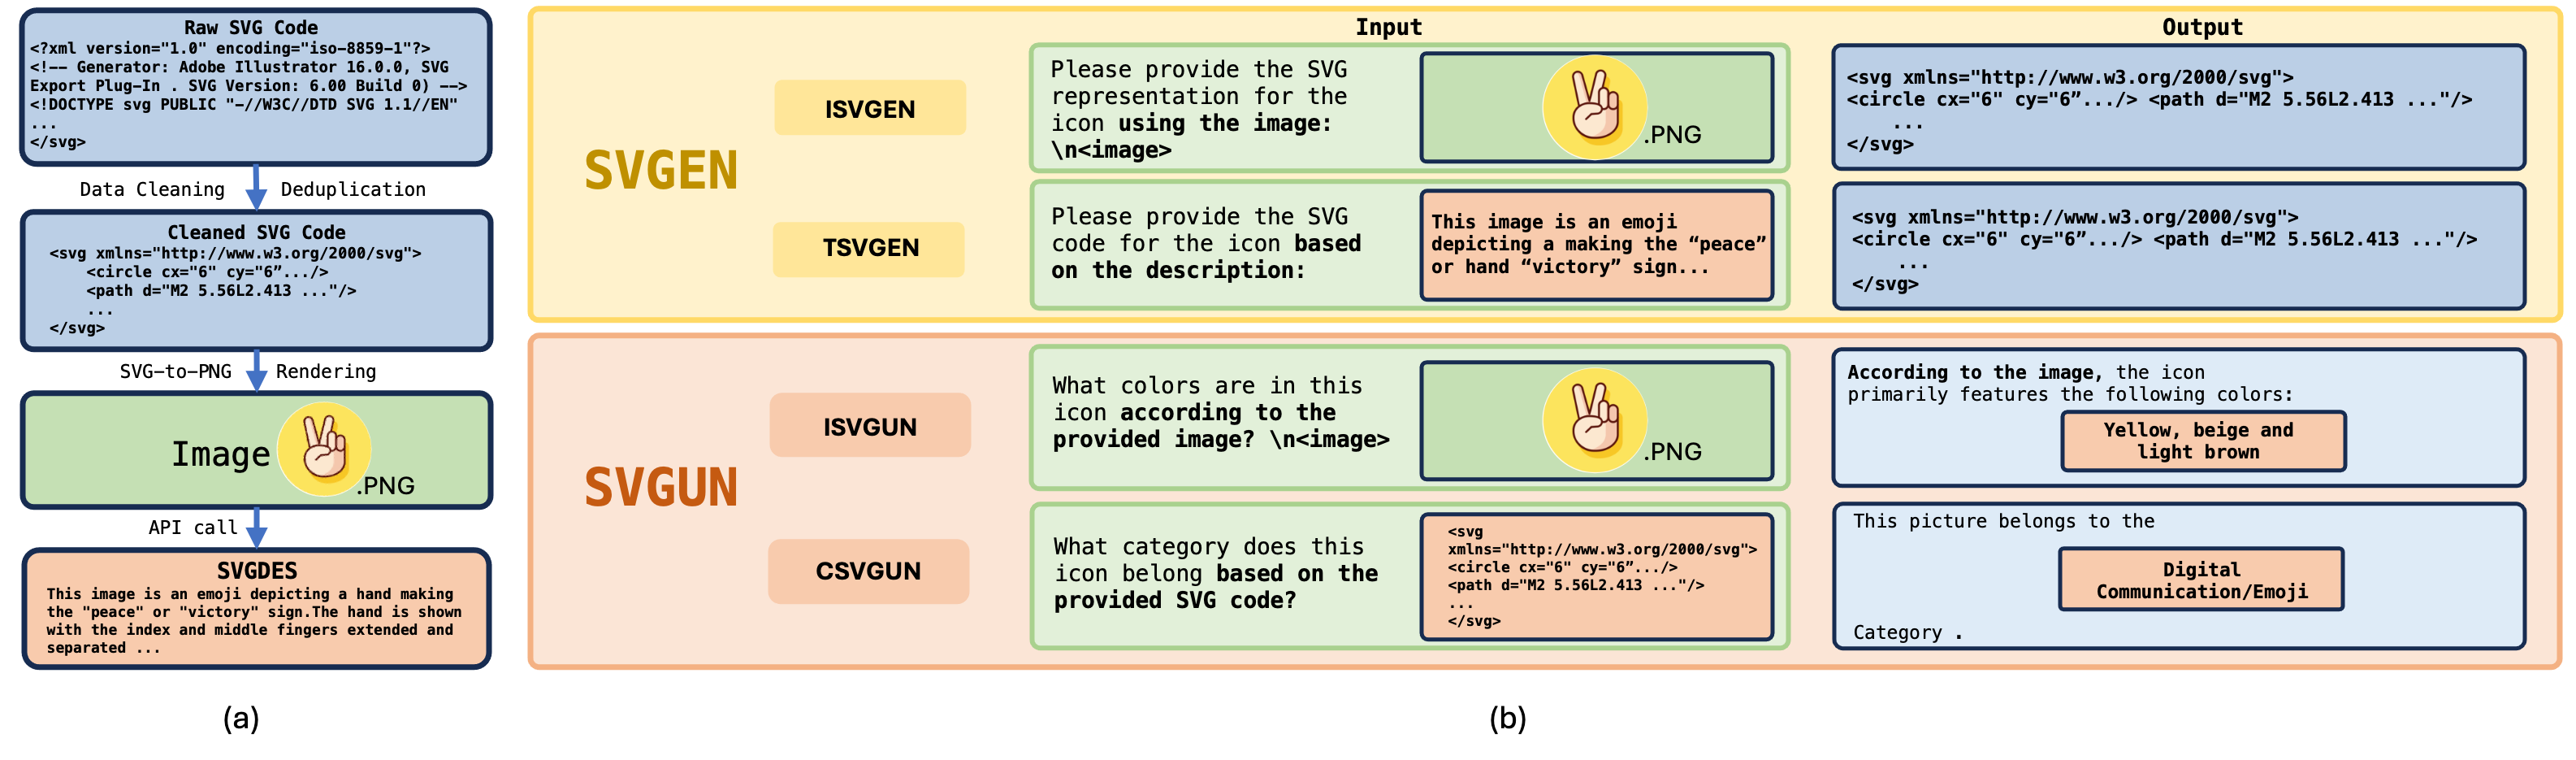
Due to the significant differences in the data format and task complexity between SVG generation and understanding, we conducted a series of data ratio experiments to determine the optimal proportion of SVGEN and SVGUN. For these experiments, we selected a 160k subset from the UniSVG dataset and used different data ratios on LLaVA 1.5. As shown in Table 1, we observed that a SVGEN:SVGUN ratio of 6:1 maximizes the quality of SVG generation while maintaining the accuracy of SVG understanding to the maximum extent. Our UniSVG dataset also follows this ratio to train models.
| Ratio SVGEN:SVGUN | Final Score | SVGEN | SVGUN | ||||||||||
|---|---|---|---|---|---|---|---|---|---|---|---|---|---|
| ISVGEN | TSVGEN | Accuracy | Bert | ||||||||||
| Low-Level | High-Level | Score | Low-Level | High-level | Score | Easy-Acc ↑ | Hard-Acc ↑ | Bert ↑ | SBert ↑ | ||||
| SSIM ↑ | LPIPS ↓ | CLIP Score ↑ | SSIM ↑ | LPIPS ↓ | CLIP Score ↑ | ||||||||
| 1 : 1 | 0.658 | 0.644 | 0.617 | 0.718 | 0.636 | 0.599 | 0.563 | 0.777 | 0.673 | 0.962 | 0.586 | 0.552 | 0.801 |
| 2 : 1 | 0.664 | 0.654 | 0.607 | 0.724 | 0.643 | 0.599 | 0.558 | 0.786 | 0.680 | 0.982 | 0.577 | 0.548 | 0.796 |
| 4 : 1 | 0.661 | 0.661 | 0.604 | 0.724 | 0.646 | 0.603 | 0.556 | 0.785 | 0.681 | 0.955 | 0.573 | 0.542 | 0.788 |
| 6 : 1 | 0.666 | 0.651 | 0.595 | 0.733 | 0.651 | 0.597 | 0.557 | 0.793 | 0.684 | 0.935 | 0.514 | 0.529 | 0.781 |
| 8 : 1 | 0.663 | 0.650 | 0.597 | 0.730 | 0.648 | 0.595 | 0.554 | 0.788 | 0.681 | 0.942 | 0.500 | 0.527 | 0.773 |
| 10 : 1 | 0.661 | 0.659 | 0.588 | 0.729 | 0.651 | 0.591 | 0.564 | 0.784 | 0.675 | 0.918 | 0.511 | 0.523 | 0.762 |
| Infinity : 1 | -- | 0.653 | 0.590 | 0.729 | 0.650 | 0.587 | 0.567 | 0.779 | 0.671 | -- | -- | -- | -- |
To better explore the potential of MLLMs in handling SVG-related tasks, we implemented data scaling. we expanded the dataset to a total of 2.2M entries including 2M SVGEN and 230K SVGUN entries besides the original UniSVG. To validate the impact of data scaling on task performance, we conducted fine-tuning experiments on the Qwen 2.5 VL model using the expanded dataset for 2 epoch. As shown in Table 2, all metrics have achieved a breakthrough increase. Due to API call limitations, the supplementary TSVGEN data only includes a single BLIP-2 [1] generated caption, which has led to limited but noticeable improvements in performance. Furthermore, our experiments strongly demonstrate that the scaling law is applicable to SVG-centric tasks, and better performance can be achieved by increasing the amount of data. We will also release this scaled 2.2M dataset later.
| Model Name | Final Score | SVGEN | SVGUN | ||||
|---|---|---|---|---|---|---|---|
| ISVGEN | TSVGEN | Easy-Acc | Hard-Acc | Bert | Sbert | ||
| Qwen 2.5 VL | 0.614 | 0.633 | 0.642 | 0.543 | 0.571 | 0.082 | 0.596 |
| Fintuned Qwen (525k) | 0.752 | 0.773 | 0.740 | 0.983 | 0.604 | 0.574 | 0.827 |
| Finetuned Qwen (2.2M) | 0.766 | 0.796 | 0.742 | 0.993 | 0.682 | 0.601 | 0.852 |
| Model Name | Final Score | SVGEN | SVGUN | ||||
|---|---|---|---|---|---|---|---|
| ISVGEN Score | TSVGEN Score | Easy Accuracy | Hard Accuracy | Bert | SBert | ||
 Scaled Finetuned Qwen 2.5 VL
|
0.766 | 0.796 | 0.742 | 0.993 | 0.682 | 0.601 | 0.852 |
| Finetuned Qwen 2.5 VL | 0.752 | 0.773 | 0.740 | 0.983 | 0.604 | 0.574 | 0.827 |
| Finetuned LLaMA 3.2 | 0.732 | 0.775 | 0.709 | 0.990 | 0.560 | 0.511 | 0.735 |
| Finetuned LLaVA-LLaMA | 0.731 | 0.764 | 0.717 | 0.940 | 0.556 | 0.524 | 0.759 |
| Claude 3.7 | 0.722 | 0.743 | 0.735 | 0.863 | 0.624 | 0.322 | 0.709 |
| Finetuned LLaVA 1.5 | 0.689 | 0.716 | 0.680 | 0.883 | 0.521 | 0.473 | 0.728 |
| GPT 4V | 0.650 | 0.638 | 0.712 | 0.893 | 0.448 | 0.211 | 0.520 |
| Gemini 1.5 pro | 0.647 | 0.644 | 0.681 | 0.923 | 0.523 | 0.254 | 0.637 |
| Qwen 2.5 VL | 0.614 | 0.633 | 0.642 | 0.543 | 0.571 | 0.082 | 0.596 |
| LLaVA 1.5 13B | 0.569 | 0.599 | 0.624 | 0.321 | 0.224 | -0.154 | 0.473 |
| LLaMA 3.2 | 0.567 | 0.592 | 0.638 | 0.347 | 0.201 | -0.291 | 0.455 |
References
- Junnan Li, Dongxu Li, Silvio Savarese, Steven Hoi. BLIP-2: Bootstrapping Language-Image Pre-training with Frozen Image Encoders and Large Language Models. arXiv preprint arXiv:2301.12597, 2023.